How advanced are corporate meetings management programs today? Just 36 percent of respondents to a new study conducted by M&C and sister publication Business Travel News say their firms practice strategic meetings management in the United States. In fact, of the 295 respondents, whose companies spent an average of $10.7 million on meetings last year, 51 percent do not have a designated meetings manager or a meetings department.
These are among key findings of the first Strategic Meetings Management and Consolidation Study, which polled professionals in meetings, travel and other senior management positions about their meetings spend, policies, consolidation efforts and more. The study was conducted by M&C, BTN and Equation Research, with co-sponsors Active Network/StarCite and Carlson Wagonlit Travel Meetings and Events. Results were cross-tabulated by industry (aerospace/defense, communications/entertainment, consulting/accounting, financial/insurance, technology, manufacturing, medical/pharmaceutical and chemical/petroleum) as well as by meetings spend. Following are highlights.
 Spending On the Rise
On average, corporations spent $10.7 million annually on meetings in 2011. The biggest spenders by industry were aerospace/
defense firms ($14.6 million) and consulting/
accounting companies ($15.4 million).
In 2011 vs. the previous year, 40 percent saw total meeting expenditures rise, while 24 percent said spending decreased and 36 percent reported no change.
For this year, 53 percent expect year-over-year meetings spend to grow again; in fact, those who anticipate an increase believe they will spend, on average, nearly 11 percent more on meetings this year than last.
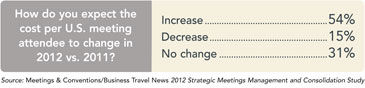
The majority of respondents (54 percent) believe cost per attendee will be higher this year than in 2011. Another 31 percent expect attendee costs to be flat, with 15 percent predicting a decrease in expenses per participant.
 Travel and Procurement
 Nearly two-thirds (62 percent) of respondents have a travel manager or travel department within their company, and such managers or departments are very or somewhat involved in meetings management, according to 63 percent of those polled. In fact, 27 percent say the travel department has become increasingly involved in meetings over the past two years.
Similarly, 44 percent report that procurement has a close hand in meetings, with 26 percent noting a recent uptick in that department's influence. Among procurement techniques applied to meetings management, one-third of respondents use service-level agreements.
On Consolidation One-third
of companies have consolidated their U.S. meetings operations. Yet,
just 24 percent of those polled say meetings data is captured centrally,
and another 24 percent have centralized meetings purchasing functions.
Forty-seven percent have not attempted to consolidate meetings
management.
One-third
of companies have consolidated their U.S. meetings operations. Yet,
just 24 percent of those polled say meetings data is captured centrally,
and another 24 percent have centralized meetings purchasing functions.
Forty-seven percent have not attempted to consolidate meetings
management.
Why not? Top reasons cited are that the company is
decentralized (40 percent), meeting owners or planners are territorial
(32 percent), lack of senior management support (22 percent) and
insufficient employee resources (20 percent). Another 20 percent say
meetings consolidation is planned but has not yet begun.
 Tech Support
Among prevalent meetings technology tools used by corporations are online air travel booking (54 percent), online hotel booking (50 percent) and attendee registration (47 percent). Another 38 percent have an electronic approvals process, 36 percent use internal calendaring, 30 percent book meeting space online and 28 percent rely on budget-tracking tools.