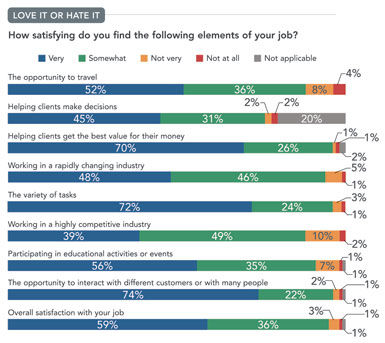
Welcome to M&C's 2012 Salary Survey, which explores planners' compensation and many other details about their jobs and attitudes toward work. In previous years, including 2010, when M&C last conducted the survey, we separately analyzed responses from association and corporate planners. This year, we have added a fast-growing category: independent/third-party professionals.
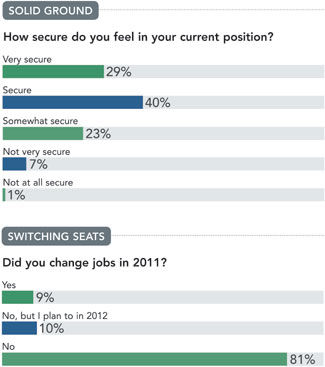
 The good news: Both association and corporate planners have seen a slight rise in salary since 2010, and the majority of the 339 respondents feel somewhat to very secure in their posts (92 percent) and are somewhat or very satisfied with their jobs (95 percent).
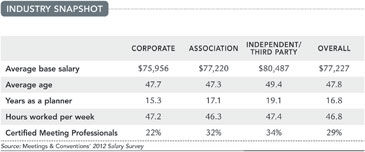
PLANNER PROFILE This year's survey was conducted online from May to mid-June, garnering responses from a wide variety of planners.
Our
analysis shows the community as a whole earns an average salary of
$77,227 per year, with independent/third-party planners earning an
average of $80,487, association planners at $77,220 and corporate
planners making $75,956.
Compared with two years ago, the
association figure of $77,220 is 4 percent higher than the 2010 salary
of $74,239, and the corporate average of $75,956 has risen 3 percent
over the $73,585 reported in 2010.
The average age of our
respondents is 48 years, no real change from 2010. Planners have been in
the industry an average of 16.8 years (17.1 years for association
planners, 15.3 years for corporate and 19.1 for independents/third
parties).
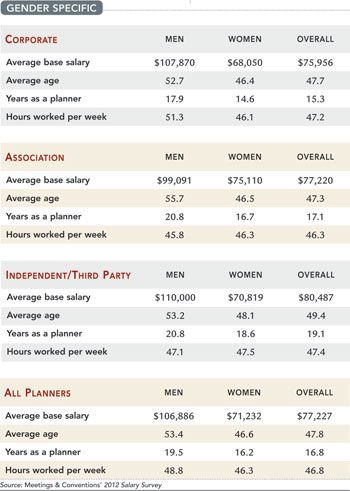
THE GENDER DIVIDEWhile the planning
universe is decidedly female (women account for 83 percent of
respondents), men continue to make more money. Our survey shows men
earning $106,886 per year, while women earn an average of $71,232, just
67 cents on the men's dollar. Granted, the men are older, averaging 53.4
years of age, compared with the women at 46.6 years; and generally, the
male respondents have been in the business longer (19.5 years vs.
16.2), and they work a few more hours per week (48.8 vs. 46.3).
 The
gender difference hits the corporate and independent/third-party
sectors hardest, where women are earning 63 cents and 64 cents on the
men's dollar, respectively. The gap is narrower for female association
planners, at 76 cents, which is much closer to the 81 cents on the men's
dollar that women make nationally, according to the U.S. Department of
Labor.
The
gender difference hits the corporate and independent/third-party
sectors hardest, where women are earning 63 cents and 64 cents on the
men's dollar, respectively. The gap is narrower for female association
planners, at 76 cents, which is much closer to the 81 cents on the men's
dollar that women make nationally, according to the U.S. Department of
Labor.
REGIONAL DIFFERENCESSalaries vary
widely around the country. Planners fare best in the Pacific states,
averaging $85,330 per year. Those in the South Atlantic region earn an
average of $80,114. The next best-paying areas are West South Central
states, where average pay is $78,875; Middle Atlantic at $78,258; and
East North Central at $76,396. Also averaging above $70,000 a year are
planners in the Mountain region, who make $71,932.
Three regions
fell under the $70,000 threshold. Planners in the West North Central of
the country earn $67,609; those in New England bring home $65,893; and
respondents in the East South Central region average just $63,889. No
one from Hawaii weighed in this year.
CERTIFICATION PAYSIn general,
planners who hold the Certified Meeting Professional designation reap
financial benefits, but still, not quite one-third of our sample (29
percent) bears the CMP. Slightly more independent/third-party planners
are certified (34 percent), followed by association planners (32
percent) and their corporate brethren (22 percent).
Among the 97
of our 339 respondents who have earned their CMP, the average salary is
$86,485, more than $9,000 above the overall average of $77,227.
Corporate
planners showed the highest monetary value from the certification,
earning an average of $94,250 per year, more than $18,000 above the
corporate average of $75,956. Association planners who are CMPs, on the
other hand, earn an average of $79,813, just $2,000 above their market's
overall average of $77,220. For independent/third-party planners,
CMP-holders earn $87,741 per year on average, more than $7,000 higher
than the segment's average of $80,487.
Who spends 91% to 100% of their work time on meetings?• 17% of corporate planners
• 26% of association planners
• 27% of independents/third parties 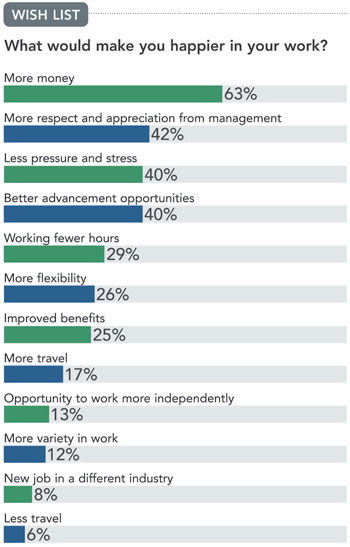
MEASURING SATISFACTION While our survey respondents generally reported being satisfied in
their jobs, they did indicate areas where changes would make them
happier (click here). Not surprisingly, more money was number one on
the wish lists, cited by 63 percent of the sample.
While our survey respondents generally reported being satisfied in
their jobs, they did indicate areas where changes would make them
happier (click here). Not surprisingly, more money was number one on
the wish lists, cited by 63 percent of the sample.
Many respondents added comments on what would make them happier at work. Among them:
• "More input on how to use our events strategically"
• "Some sort of event or project-management software to manage the 250 events I am responsible for"
• "The opportunity to work from home"
• "Less interference from the board with matters they do not comprehend and cannot understand"
• "Improved work atmosphere"
• "Retirement"